
Find the best tutors and institutes for Class 10 Tuition
Q1:
The following table shows the ages of the patients admitted in a hospital during a year:
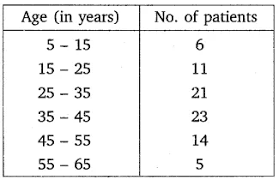
Find the mode and the mean of the data given above. Compare and interpret the two measures of central tendency.
The following table shows the ages of the patients admitted in a hospital during a year:
Find the mode and the mean of the data given above. Compare and interpret the two measures of central tendency.
Solution :
Given: The frequency distribution of ages of patients admitted to a hospital:
| Age (in years) | 5-15 | 15-25 | 25-35 | 35-45 | 45-55 | 55-65 |
|---|---|---|---|---|---|---|
| Number of patients ($f_i$) | 6 | 11 | 21 | 23 | 14 | 5 |
To Find: The Mode and the Mean of the given data, and to compare and interpret the results.
Part 1: Calculation of Mode
Formula: $\text{Mode} = l + \left( \frac{f_1 - f_0}{2f_1 - f_0 - f_2} \right) \times h$
Where:
- $l$ = lower limit of the modal class
- $h$ = size of the class interval
- $f_1$ = frequency of the modal class
- $f_0$ = frequency of the class preceding the modal class
- $f_2$ = frequency of the class succeeding the modal class
Step 1.1: Identify the Modal Class. The maximum frequency is $23$, which corresponds to the class interval $35-45$. Thus, the modal class is $35-45$.
Step 1.2: Assign values. $l = 35$, $f_1 = 23$, $f_0 = 21$, $f_2 = 14$, $h = 10$.
Step 1.3: Substitute into the formula.
$\text{Mode} = 35 + \left( \frac{23 - 21}{2(23) - 21 - 14} \right) \times 10$
$\text{Mode} = 35 + \left( \frac{2}{46 - 35} \right) \times 10 = 35 + \left( \frac{2}{11} \right) \times 10 = 35 + \frac{20}{11} \approx 35 + 1.818 = 36.82$
Part 2: Calculation of Mean
Step 2.1: Prepare the table for Assumed Mean Method ($A = 40$).
| Age | $f_i$ | Class Mark ($x_i$) | $d_i = x_i - 40$ | $f_i d_i$ |
|---|---|---|---|---|
| 5-15 | 6 | 10 | -30 | -180 |
| 15-25 | 11 | 20 | -20 | -220 |
| 25-35 | 21 | 30 | -10 | -210 |
| 35-45 | 23 | 40 | 0 | 0 |
| 45-55 | 14 | 50 | 10 | 140 |
| 55-65 | 5 | 60 | 20 | 100 |
| Total | 80 | - | - | -370 |
Step 2.2: Apply the Mean formula.
$\text{Mean} (\bar{x}) = A + \frac{\sum f_i d_i}{\sum f_i} = 40 + \left( \frac{-370}{80} \right) = 40 - 4.625 = 35.375$
Part 3: Comparison and Interpretation
The modal age is approximately $36.82$ years, representing the age group with the highest number of patients admitted. The mean age is $35.38$ years, representing the average age of all patients admitted. Since the mean is slightly less than the mode, it indicates that the distribution is slightly negatively skewed, but both measures suggest that the majority of patients admitted are in the mid-30s age range.
Final Answer: The Mode is 36.82 years and the Mean is 35.38 years.
More Questions from Class 10 Mathematics Statistics EXERCISE 13.2
- Q2: The following data gives the information on the observed lifetimes (in hours) of 225 electrical components : Determine the modal lifetimes of the components.
- Q3: The following data gives the distribution of total monthly household expenditure of 200 families of a village. Find the modal monthly expenditure of the families. Also, find the mean monthly expenditure :
- Q4: The following distribution gives the state-wise teacher-student ratio in higher secondary schools of India. Find the mode and mean of this data. Interpret the two measures.
- Q5: The given distribution shows the number of runs scored by some top batsmen of the world in one-day international cricket matches. Find the mode of the data.
- Q6: A student noted the number of cars passing through a spot on a road for 100 periods each of 3 minutes and summarised it in the table given below. Find the mode of the data:
CBSE Solutions for Class 10 Mathematics Statistics
Chapters in CBSE - Class 10 Mathematics
Top Tutors who teach Statistics
Akshay is an excellent teacher. He has taught my son in 10 th standard science , with which he understood the concepts clearly and he also gave so many past question papers for my son to work out, all these made my son score 95 in board exams . I would definitely recommend Akshay for students who want to improve and get good scores in science .
With a decade of experience in teaching mathematics, physics, and chemistry for students from grades 8 through 12 across CBSE, IB, and ICSE boards, I offer a comprehensive educational approach that caters to a diverse range of curricula and learning needs. My academic background includes a BE and an MBA, equipping me with both technical and managerial skills that enhance my teaching methodology. Throughout my career, I have specialized in home tutoring, where I have developed a personalized approach to education that focuses on each student's unique needs and strengths. My sessions are designed to be interactive and engaging, fostering a learning environment where students feel supported and motivated. I conduct both online and offline classes, each lasting one hour, and utilize a variety of teaching tools to facilitate learning. I employ a whiteboard to visually explain concepts and provide question papers to help students practice and prepare for their exams. This hands-on approach ensures that students not only understand theoretical concepts but also develop problem-solving skills and confidence in their subjects. My commitment to delivering high-quality education and my extensive experience make me well-suited to guide students through their academic journey, helping them achieve their full potential in mathematics, physics, and chemistry.
I have done b.Tech in electrical engineering from IIT KANPUR. I taught one year in akash institute patna, 2 years in fiitjee patna. Currently I am teaching in unacademy. I have taught more than 6000 jee and neet aspirants. In which more than 500 students are selected in iitand aiims. If some one is interested to improve their physics upto jee advanced level take help with me .And see the magic. I can help students in their all type of assignment from any institute like allen, fiitjee, narayna, akash, resonance. I can help students to solve both volume of h.C verma within two month if some one is intrested in solving I.E.Irodov join me and see the next level of physics. My way of teaching is so easy and so advanced that student will realyy enjoy it. Don't waste your time in making decision just join and experience my level
He is a very dedicated teacher with excellent knowledge on topic. He knows Subject very well and teach accordingly to kids.
With over 15 years of dedicated teaching experience, I am an accomplished and qualified educator specializing in Spoken English, Math, Science, Social Science, and Kannada Language. My expertise extends across various educational boards, including CBSE, ICSE, and state boards. Passionate about unraveling the mysteries of mathematical problems and chemical equations. I have garnered recognition with the prestigious Best Teacher Award for orchestrating state-level Science exams. Having contributed my skills to the esteemed MaxMuller Public School in Bangalore, I am committed to fostering a nurturing and inspiring learning environment. Join me on this educational journey where knowledge meets enthusiasm!
I've been teaching Class 10th students of schools from India and abroad. I primarily work with them to prepare for Olympiad, JEE foundation and school exams. I've been teaching students of class 8th-10th Science and Mathematics for more than 3 years. So far, I have taught more than 100 students from India and abroad. I teach international students Mathematics, Physics and Chemistry. I teach almost all boards of India such as CBSE, ICSE and state boards. I also teach IGCSE and IB students. I've my offline coaching institute where I am teaching students of CBSE and state boards who require help in Science and Mathematics. Fee displayed on my profile is for 1×1 classes. For group classes, the fee is substantially reduced.
Find more Tutor for Statistics in your City
- Delhi Mathematics Tutors
- Bangalore Mathematics Tutors
- Hyderabad Mathematics Tutors
- Chennai Mathematics Tutors
- Kolkata Mathematics Tutors
- Mumbai Mathematics Tutors
- Noida Mathematics Tutors
- Pune Mathematics Tutors
- Gurgaon Mathematics Tutors
- Lucknow Mathematics Tutors
- Ghaziabad Mathematics Tutors
- Jaipur Mathematics Tutors

